APU Software

Loudness Contour

Shape frequency response with loudness contours

Sale price $30.00 one-time · Regular price $40.00

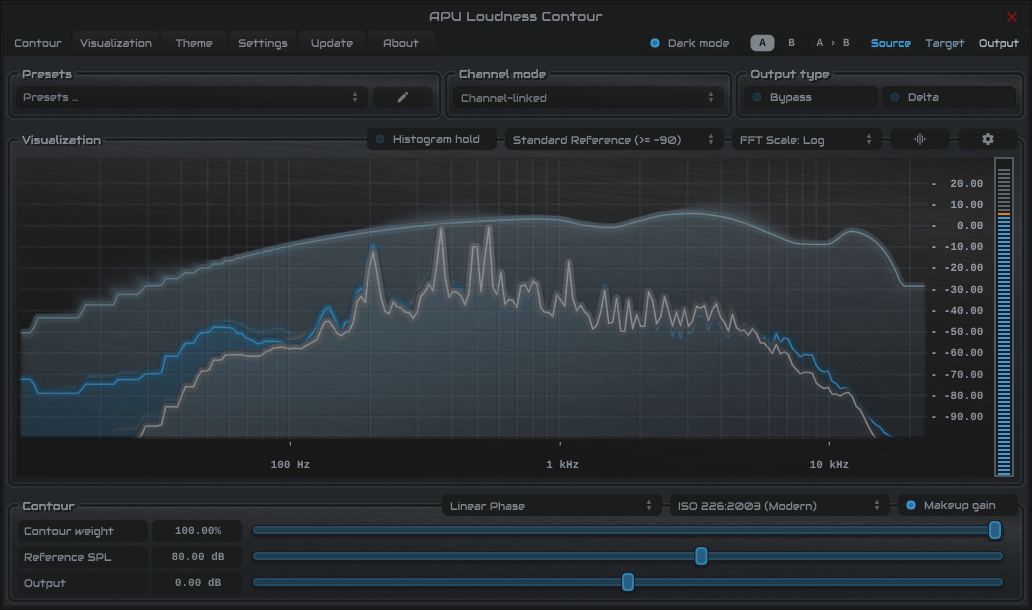
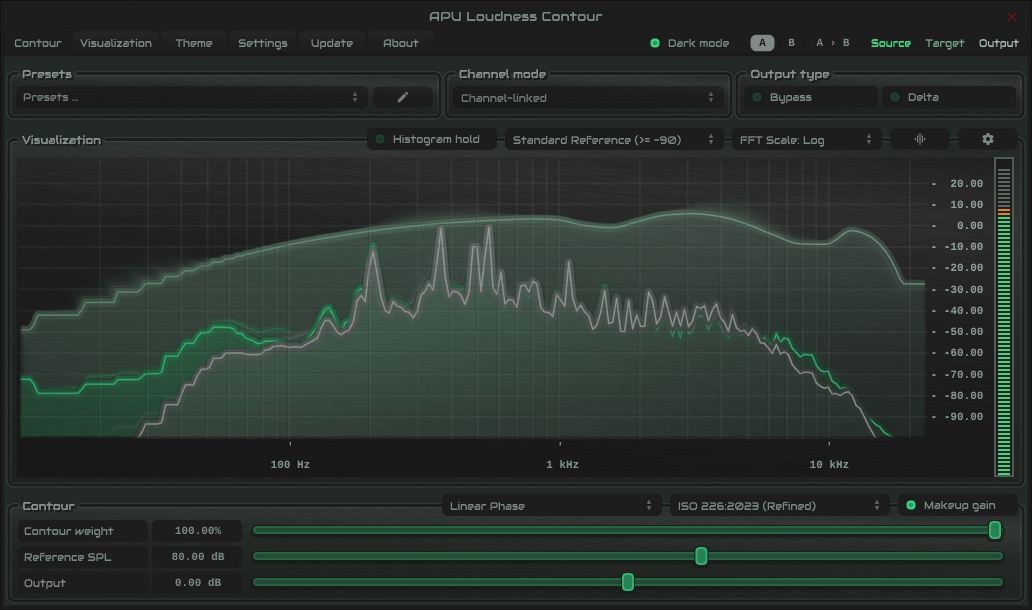
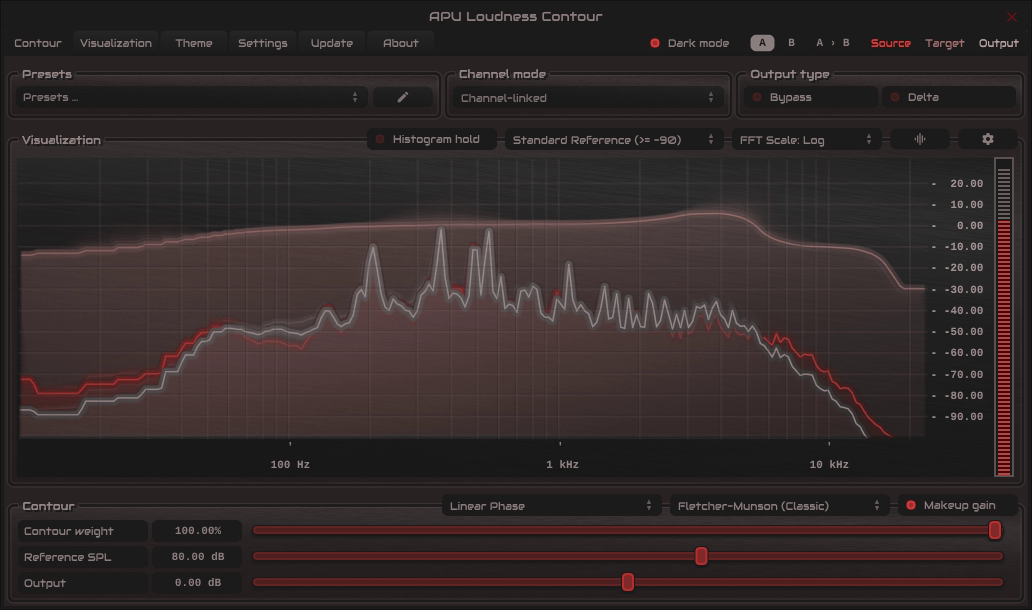
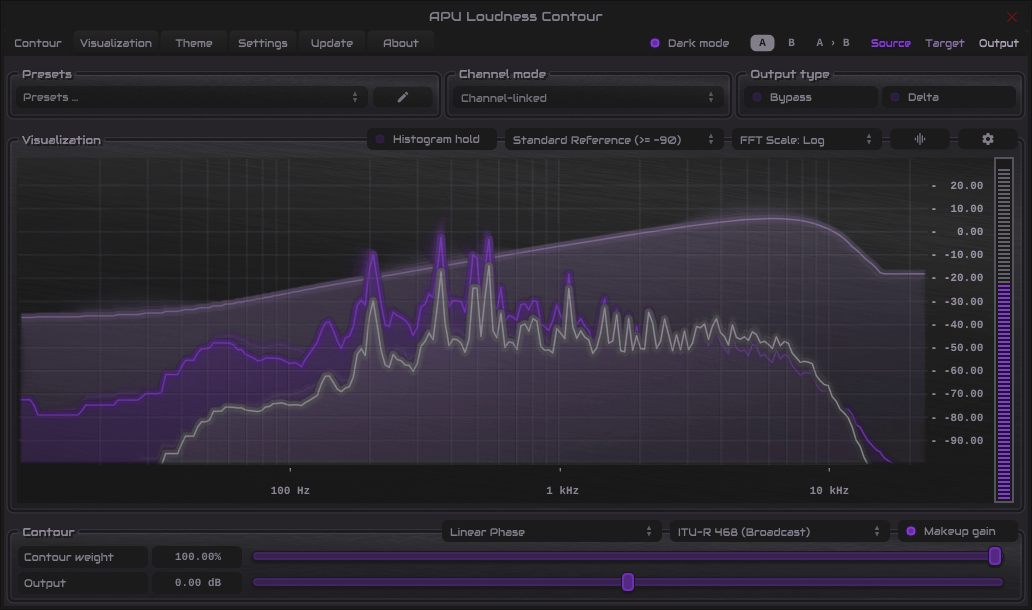
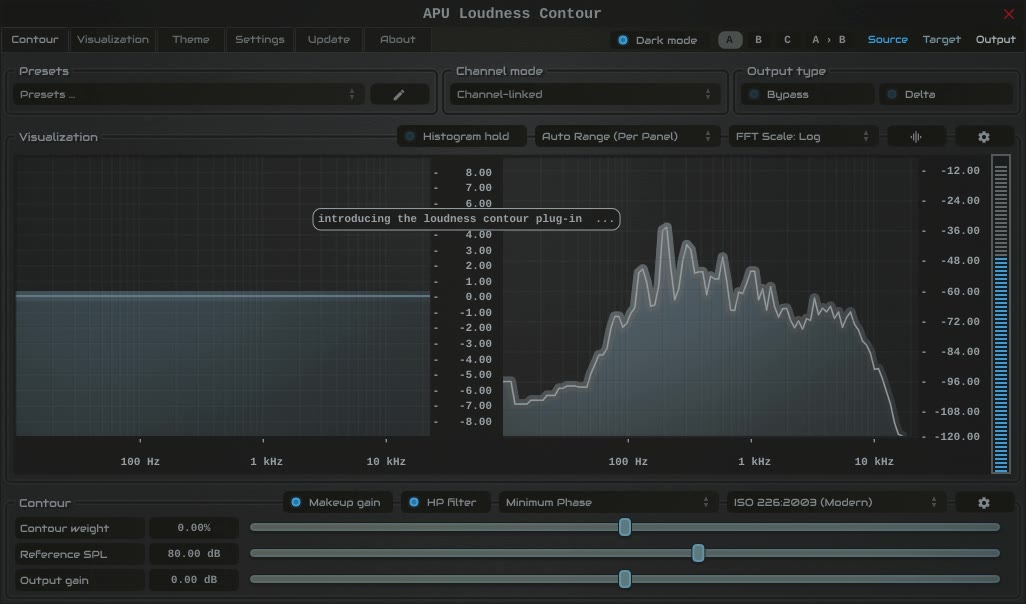
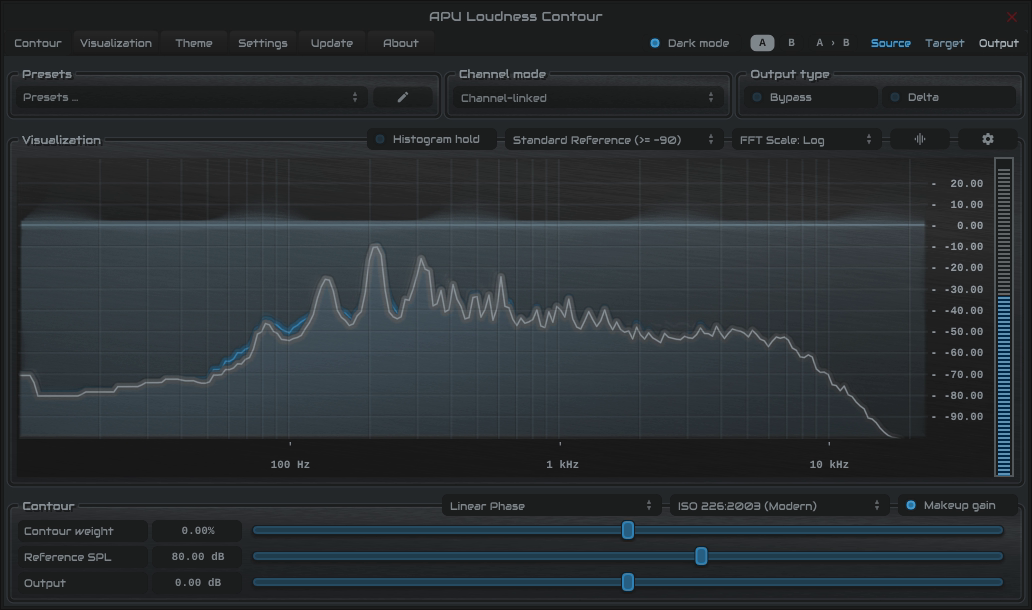
APU Loudness Contour interface
APU Loudness Contour demonstration
Fall Sale: 25% Off automatically applied at checkout.

APU Loudness Contour applies equal-loudness contours and frequency weighting curves to audio. Choose ISO 226 (2003 or 2023), Fletcher-Munson, K-weighting, A/C-weighting, ECMA-418, or ITU-R 468.

The curves are normalized to 0 dB at 1 kHz. Use contour weight to adjust the amount: 0% is flat, positive values apply the curve, and negative values invert it.

For ISO 226 and Fletcher-Munson, reference SPL selects the curve’s phon level across the plug-in’s 20-120 range. Enable Adaptive SPL to adjust that reference as the input loudness changes.

Choose linear phase or minimum phase filtering. Optional makeup gain uses pink-noise LUFS measurements to compensate for level changes caused by the selected contour and reference level. Output gain is available for further adjustment.

The spectrum analyzer shows the result with adjustable FFT size, window type, bucket width, and averaging. View frequencies on a linear, logarithmic, or musical-note scale.

Fall Sale
Download (30-day Trial)

Note: Existing customers can apply their loyalty discount at the cart page.
System requirements: macOS 10.14 (x64, ARM), Windows 10 (x86, x64), OpenGL 3.2.
Supported software formats: Standalone application, VST, AU, AAX (Pro Tools 11+).
Use Cases

A few ways to use the plug-in:

Shape a compressor’s sidechain

Place Contour before an external sidechain input to change which frequencies drive the compressor. Choose a curve and adjust its weight while listening to the gain reduction. The compressor still applies gain to its main input; Contour is shaping the detector signal.

Try broad tonal changes

Apply a contour to a track or bus and compare positive and negative weights. Start with a small amount and use output gain to compare at similar listening levels.

Compare weighting curves

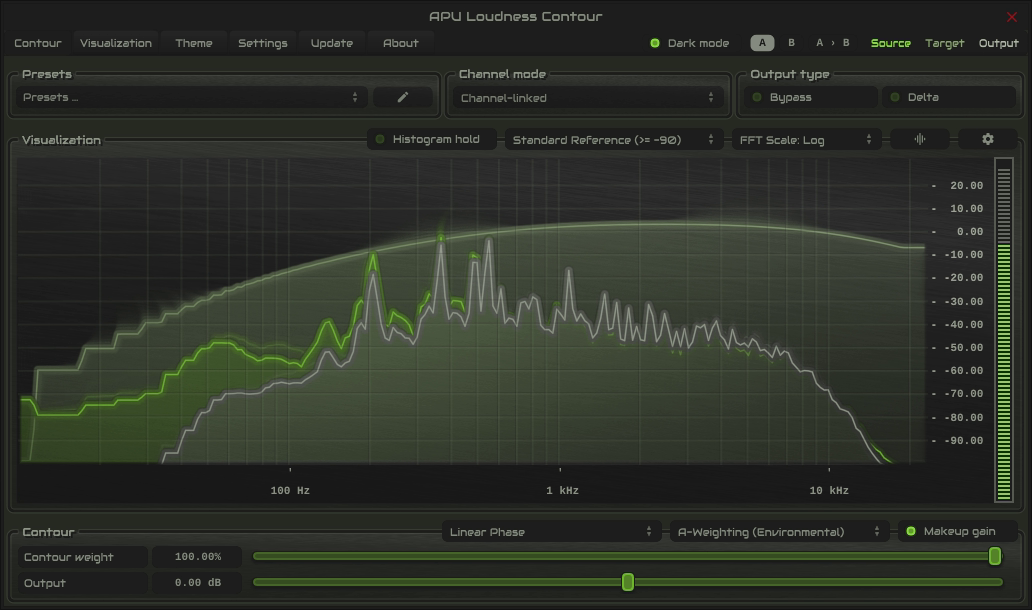
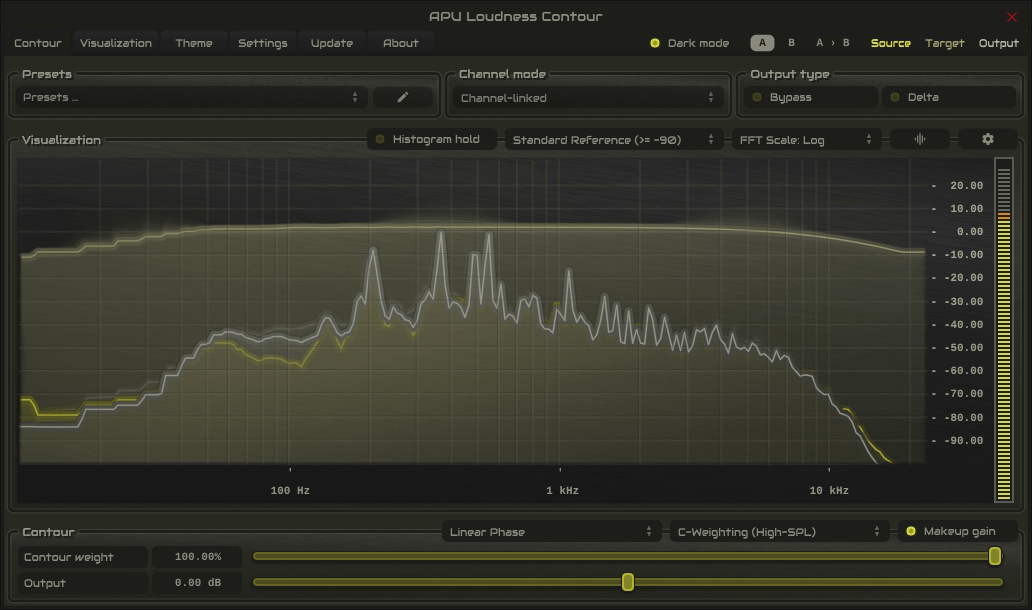
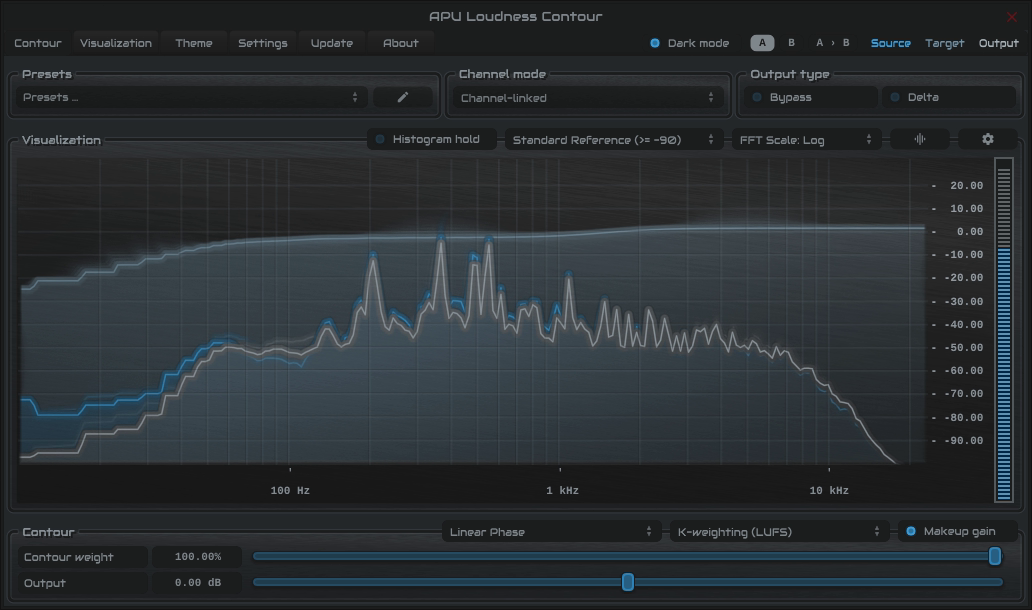
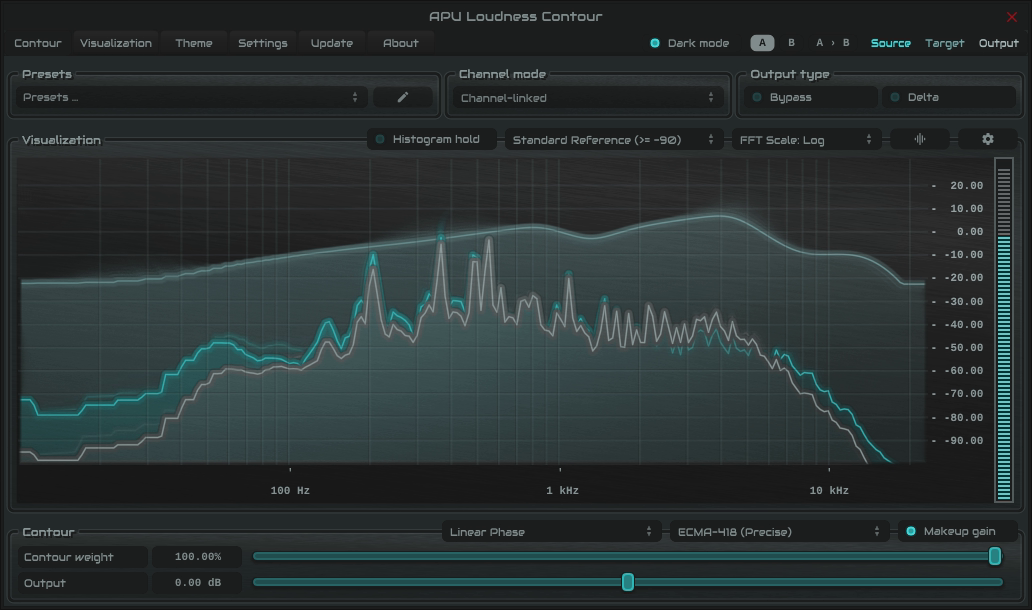
View and listen to the differences between K-weighting, A-weighting, C-weighting, and the other models. The response display makes it easy to see which frequencies each curve emphasizes or attenuates.

Explore level-dependent contours

With ISO 226 or Fletcher-Munson selected, change Reference SPL to hear how the contour varies with level. For gain control that compensates for the difference between two listening levels, see TrueGain.

Back to top

Contour Types

ISO 226 and Fletcher-Munson vary with the selected reference level. The other weighting curves have a fixed shape. Contour weight lets you scale or invert either type.

K-weighting

K-weighting is the frequency weighting used in LUFS metering. It combines a high-pass filter with a high-frequency shelf. Contour lets you apply that response directly to audio, normalized at 1 kHz.

K-weightingView full size

ECMA-418

ECMA-418 uses the outer- and middle-ear weighting curve from the ECMA-418-2 hearing model. This is the model’s frequency response, not an implementation of its full loudness calculation. Adjust contour weight to scale or invert the response.

ECMA-418View full size

ISO 226 (2003)

ISO 226:2003 describes equal-loudness contours measured with pure tones under controlled listening conditions. Contour uses these curves as a basis for filtering, with interpolation across its 20-120 reference range. Adjust Reference SPL to select the level and contour weight to set the amount.

ISO 226View full size

ISO 226 (2023)

ISO 226:2023 is the newer edition of the equal-loudness standard. This option uses the plug-in’s 2023 curve family with the same Reference SPL, Adaptive SPL, and contour weight controls, so you can compare it with the 2003 model at the same settings.

ISO 226View full size

Fletcher-Munson

Fletcher-Munson uses curves digitized from Fletcher and Munson’s 1933 research. The plug-in interpolates between reference levels across its 20-120 range, giving you an alternative to the ISO models.

Fletcher-MunsonView full size

ITU-R 468

ITU-R 468 is a noise-weighting curve with a pronounced upper-midrange emphasis. Use contour weight to adjust how strongly that response is applied.

ITU-R 468View full size

A-weighting

A-weighting is common in sound-level measurement. It strongly attenuates low frequencies and also rolls off the high end.

A-weightingView full size

C-weighting

C-weighting has a flatter response than A-weighting, with much less low-frequency attenuation.

C-weightingView full size

None

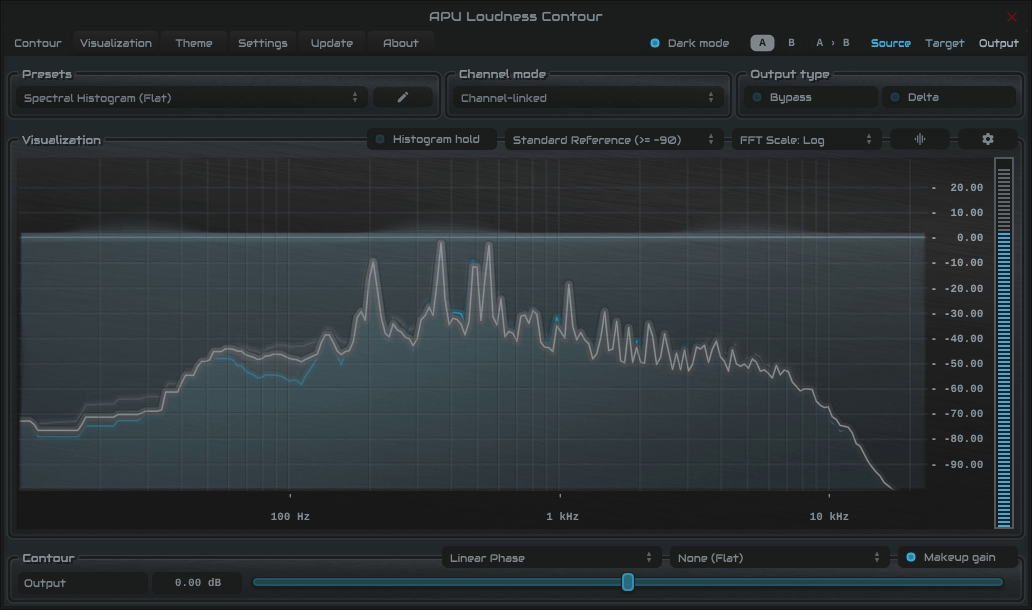
None disables contour filtering for a flat response.

No contourView full size

Back to top

Credits

Developed by APU Software, LLC with the following libraries:

Demo video song credits:


VST compatible ASIO compatible

Back to top

Actual size

Shown at its native size. Swipe or scroll to explore the full interface.