APU TrueGain is a frequency-compensated gain control plug-in based on equal-loudness contours like ISO 226. The plug-in’s filtering is meticulously designed to provide smooth, precise frequency compensation which adapts continuously over time using an Adaptive SPL algorithm that tracks the perceived loudness of the input signal.
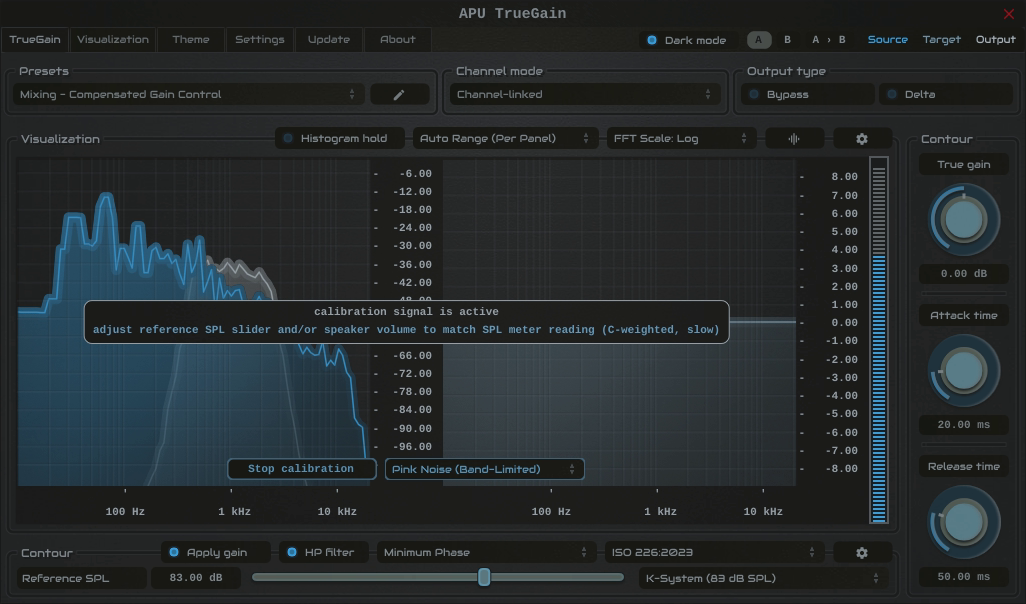
To ensure its perceptual modeling is accurate, TrueGain features a straightforward calibration process that aligns the plug-in with the true Sound Pressure Level at your listening position. Using any standard SPL meter, you can match the plug-in to your physical environment, ensuring all loudness simulations are precise and repeatable.
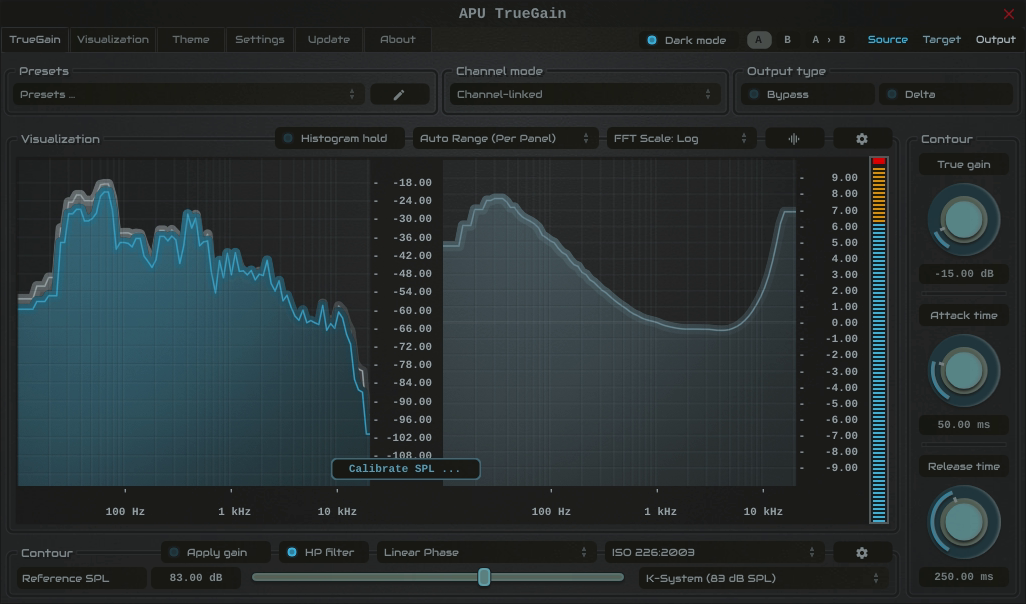
A comprehensive, real-time spectral analyzer provides clear visual feedback on your source, target, and output signals throughout the process.
TrueGain can be operated in three modes:
- Compensated Gain Control
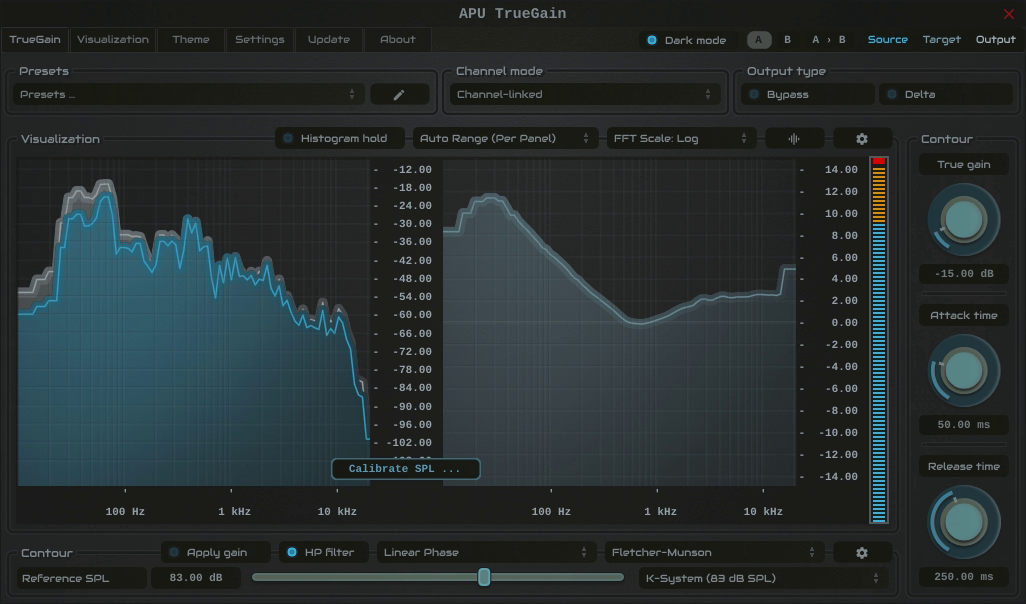
Adjust the True gain parameter to apply frequency-compensated gain or attenuation based on your calibrated listening level. This allows you to maintain a consistent frequency balance as you adjust the overall loudness of your mix.
- Compensated AGC
In this mode, you can set a target SPL level, and TrueGain will automatically adjust the output gain to maintain that level, automatically loudness-compensating the frequency balance as the input signal level changes. Attack and release controls allow you to fine-tune the responsiveness of the gain and frequency domain adjustments.
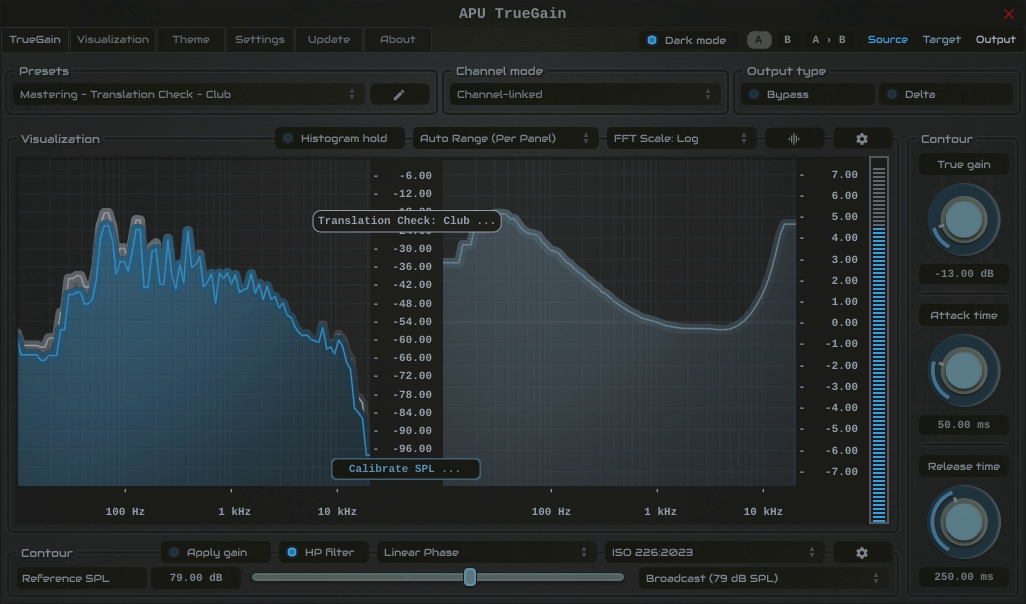
- Translation Check
In this mode, you can use the target SPL parameter to accurately simulate how your mix sounds at different levels-from quiet home listening to loud club playback, without actually changing the monitoring volume. Useful when you want to quickly make sure the mix translates well at various listening levels and still be able to hear the details clearly.
- Gain Control
This mode is identical to compensated gain control, but without any frequency compensation applied. Parameters are still run through the ballistics engine, so gain and frequency adjustments remain smooth and musical.

Note: Existing customers can request a discount code using the support beacon on the bottom-right.
System requirements: macOS 10.14 (x64, ARM), Windows 10 (x86, x64), OpenGL 3.2.
Supported software formats: Standalone application, VST, AU, AAX (Pro Tools 11+).